Querying ECCO variables and descriptions
What is a ShortName?
On NASA Earthdata, ECCO output is organized into datasets, each consisting of a few related variables. (For example, the “sea surface height” dataset contains three sea surface height variables, each with different corrections applied, as well as a variable containing one of the correction amounts.) Each dataset is identified by a “ShortName”, which is a quick way to identify and locate the dataset on Earthdata search and in the Common Metadata Repository (CMR). The ShortName for the monthly sea surface height dataset on the native LLC90 grid is ECCO_L4_SSH_LLC0090GRID_MONTHLY_V4R4.
But…what if you don’t know the ShortName already? Find your data with ecco_access
Earthdata datasets are identified by ShortNames, but you might not know the ShortName of the variable or category of variables that you are seeking. One way to find the ShortName is to consult these ECCO variable lists. But the “query” in ecco_access functions does not have to be a ShortName; it can also be a text string representing a variable name, or a word or phrase in
the variable description.
For example, perhaps you are looking to open the dataset that has native grid monthly sea ice concentration in 2007. If the query is not identified as a ShortName, then a text search of the variable lists is conducted using query, grid, and time_res. Then of the identified matches, the user is asked to select one.
[1]:
import numpy as np
import xarray as xr
from os.path import join,expanduser
import matplotlib.pyplot as plt

import ecco_access as ea

# identify user's home directory
user_home_dir = expanduser('~')

# query variable lists for "ice" and open the selected result as an xarray dataset
ds_seaice_conc = ea.ecco_podaac_to_xrdataset('ice',grid='native',time_res='monthly',\
                                               StartDate='2007-01',EndDate='2007-12',\
                                               mode='download_ifspace',\
                                               download_root_dir=\
                                                 join(user_home_dir,'Downloads','ECCO_V4r4_PODAAC'),\
                                               max_avail_frac=0.5)
ShortName Options for query "ice":
                  Variable Name     Description (units)

Option 1: ECCO_L4_SSH_LLC0090GRID_MONTHLY_V4R4    *native grid,monthly means*
                  SSH               Dynamic sea surface height anomaly. Suitable for
                                    comparisons with altimetry sea surface height data
                                    products that apply the inverse barometer
                                    correction. (m)
                  SSHIBC            The inverted barometer correction to sea surface
                                    height due to atmospheric pressure loading. (m)
                  SSHNOIBC          Sea surface height anomaly without the inverted
                                    barometer correction. Suitable for comparisons
                                    with altimetry sea surface height data products
                                    that do NOT apply the inverse barometer
                                    correction. (m)
                  ETAN              Model sea level anomaly, without corrections for
                                    global mean density changes, inverted barometer
                                    effect, or volume displacement due to submerged
                                    sea-ice and snow. (m)

Option 2: ECCO_L4_STRESS_LLC0090GRID_MONTHLY_V4R4    *native grid,monthly means*
                  EXFtaux           Wind stress in the model +x direction (N/m^2)
                  EXFtauy           Wind stress in the model +y direction (N/m^2)
                  oceTAUX           Ocean surface stress in the model +x direction,
                                    due to wind and sea-ice (N/m^2)
                  oceTAUY           Ocean surface stress in the model +y direction,
                                    due to wind and sea-ice (N/m^2)

Option 3: ECCO_L4_HEAT_FLUX_LLC0090GRID_MONTHLY_V4R4    *native grid,monthly means*
                  EXFhl             Open ocean air-sea latent heat flux (W/m^2)
                  EXFhs             Open ocean air-sea sensible heat flux (W/m^2)
                  EXFlwdn           Downward longwave radiative flux (W/m^2)
                  EXFswdn           Downwelling shortwave radiative flux (W/m^2)
                  EXFqnet           Open ocean net air-sea heat flux (W/m^2)
                  oceQnet           Net heat flux into the ocean surface (W/m^2)
                  SIatmQnt          Net upward heat flux to the atmosphere (W/m^2)
                  TFLUX             Rate of change of ocean heat content per m^2
                                    accounting for mass (e.g. freshwater) fluxes
                                    (W/m^2)
                  EXFswnet          Open ocean net shortwave radiative flux (W/m^2)
                  EXFlwnet          Net open ocean longwave radiative flux (W/m^2)
                  oceQsw            Net shortwave radiative flux across the ocean
                                    surface (W/m^2)
                  SIaaflux          Conservative ocean and sea-ice advective heat flux
                                    adjustment, associated with temperature difference
                                    between sea surface temperature and sea-ice,
                                    excluding latent heat of fusion (W/m^2)

Option 4: ECCO_L4_FRESH_FLUX_LLC0090GRID_MONTHLY_V4R4    *native grid,monthly means*
                  EXFpreci          Precipitation rate (m/s)
                  EXFevap           Open ocean evaporation rate (m/s)
                  EXFroff           River runoff (m/s)
                  SIsnPrcp          Snow precipitation on sea-ice (kg/(m^2 s))
                  EXFempmr          Open ocean net surface freshwater flux from
                                    precipitation, evaporation, and runoff (m/s)
                  oceFWflx          Net freshwater flux into the ocean (kg/(m^2 s))
                  SIatmFW           Net freshwater flux into the open ocean, sea-ice,
                                    and snow (kg/(m^2 s))
                  SFLUX             Rate of change of total ocean salinity per m^2
                                    accounting for mass fluxes (g/(m^2 s))
                  SIacSubl          Freshwater flux to the atmosphere due to
                                    sublimation-deposition of snow or ice (kg/(m^2 s))
                  SIrsSubl          Residual sublimation freshwater flux (kg/(m^2 s))
                  SIfwThru          Precipitation through sea-ice (kg/(m^2 s))

Option 5: ECCO_L4_SEA_ICE_CONC_THICKNESS_LLC0090GRID_MONTHLY_V4R4    *native grid,monthly means*
                  SIarea            Sea-ice concentration (fraction between 0 and 1)
                  SIheff            Area-averaged sea-ice thickness (m)
                  SIhsnow           Area-averaged snow thickness (m)
                  sIceLoad          Average sea-ice and snow mass per unit area
                                    (kg/m^2)

Option 6: ECCO_L4_SEA_ICE_VELOCITY_LLC0090GRID_MONTHLY_V4R4    *native grid,monthly means*
                  SIuice            Sea-ice velocity in the model +x direction (m/s)
                  SIvice            Sea-ice velocity in the model +y direction (m/s)

Option 7: ECCO_L4_SEA_ICE_HORIZ_VOLUME_FLUX_LLC0090GRID_MONTHLY_V4R4    *native grid,monthly means*
                  ADVxHEFF          Lateral advective flux of sea-ice thickness in the
                                    model +x direction (m^3/s)
                  ADVyHEFF          Lateral advective flux of sea-ice thickness in the
                                    model +y direction (m^3/s)
                  DFxEHEFF          Lateral diffusive flux of sea-ice thickness in the
                                    model +x direction (m^3/s)
                  DFyEHEFF          Lateral diffusive flux of sea-ice thickness in the
                                    model +y direction (m^3/s)
                  ADVxSNOW          Lateral advective flux of snow thickness in the
                                    model +x direction (m^3/s)
                  ADVySNOW          Lateral advective flux of snow thickness in the
                                    model +y direction (m^3/s)
                  DFxESNOW          Lateral diffusive flux of snow thickness in the
                                    model +x direction (m^3/s)
                  DFyESNOW          Lateral diffusive flux of snow thickness in the
                                    model +y direction (m^3/s)

Option 8: ECCO_L4_SEA_ICE_SALT_PLUME_FLUX_LLC0090GRID_MONTHLY_V4R4    *native grid,monthly means*
                  oceSPflx          Net salt flux into the ocean due to brine
                                    rejection (g/(m^2 s))
                  oceSPDep          Salt plume depth (m)
Please select option [1-8]: 5
Using dataset with ShortName: ECCO_L4_SEA_ICE_CONC_THICKNESS_LLC0090GRID_MONTHLY_V4R4
Creating download directory /home/jpluser/Downloads/ECCO_V4r4_PODAAC/ECCO_L4_SEA_ICE_CONC_THICKNESS_LLC0090GRID_MONTHLY_V4R4
Size of files to be downloaded to instance is 0.06 GB,
which is 0.3% of the 20.008 GB available storage.
Proceeding with file downloads via NASA Earthdata URLs
DL Progress: 100%|#########################| 12/12 [00:04<00:00,  2.56it/s]

=====================================
total downloaded: 64.66 Mb
avg download speed: 13.73 Mb/s
Time spent = 4.708296537399292 seconds
We select option 5, corresponding to ShortName ECCO_L4_SEA_ICE_CONC_THICKNESS_LLC0090GRID_MONTHLY_V4R4. Let’s look at the dataset contents.
[2]:
ds_seaice_conc
[2]:
<xarray.Dataset> Size: 25MB
Dimensions:    (time: 12, tile: 13, j: 90, i: 90, i_g: 90, j_g: 90, nv: 2, nb: 4)
Coordinates: (12/13)
  * i          (i) int32 360B 0 1 2 3 4 5 6 7 8 9 ... 81 82 83 84 85 86 87 88 89
  * i_g        (i_g) int32 360B 0 1 2 3 4 5 6 7 8 ... 81 82 83 84 85 86 87 88 89
  * j          (j) int32 360B 0 1 2 3 4 5 6 7 8 9 ... 81 82 83 84 85 86 87 88 89
  * j_g        (j_g) int32 360B 0 1 2 3 4 5 6 7 8 ... 81 82 83 84 85 86 87 88 89
  * tile       (tile) int32 52B 0 1 2 3 4 5 6 7 8 9 10 11 12
  * time       (time) datetime64[ns] 96B 2007-01-16T12:00:00 ... 2007-12-16T1...
    ...         ...
    YC         (tile, j, i) float32 421kB dask.array<chunksize=(13, 90, 90), meta=np.ndarray>
    XG         (tile, j_g, i_g) float32 421kB dask.array<chunksize=(13, 90, 90), meta=np.ndarray>
    YG         (tile, j_g, i_g) float32 421kB dask.array<chunksize=(13, 90, 90), meta=np.ndarray>
    time_bnds  (time, nv) datetime64[ns] 192B dask.array<chunksize=(1, 2), meta=np.ndarray>
    XC_bnds    (tile, j, i, nb) float32 2MB dask.array<chunksize=(13, 90, 90, 4), meta=np.ndarray>
    YC_bnds    (tile, j, i, nb) float32 2MB dask.array<chunksize=(13, 90, 90, 4), meta=np.ndarray>
Dimensions without coordinates: nv, nb
Data variables:
    SIarea     (time, tile, j, i) float32 5MB dask.array<chunksize=(1, 13, 90, 90), meta=np.ndarray>
    SIheff     (time, tile, j, i) float32 5MB dask.array<chunksize=(1, 13, 90, 90), meta=np.ndarray>
    SIhsnow    (time, tile, j, i) float32 5MB dask.array<chunksize=(1, 13, 90, 90), meta=np.ndarray>
    sIceLoad   (time, tile, j, i) float32 5MB dask.array<chunksize=(1, 13, 90, 90), meta=np.ndarray>
Attributes: (12/57)
    acknowledgement:              This research was carried out by the Jet Pr...
    author:                       Ian Fenty and Ou Wang
    cdm_data_type:                Grid
    comment:                      Fields provided on the curvilinear lat-lon-...
    Conventions:                  CF-1.8, ACDD-1.3
    coordinates_comment:          Note: the global 'coordinates' attribute de...
    ...                           ...
    time_coverage_duration:       P1M
    time_coverage_end:            2007-02-01T00:00:00
    time_coverage_resolution:     P1M
    time_coverage_start:          2007-01-01T00:00:00
    title:                        ECCO Sea-Ice and Snow Concentration and Thi...
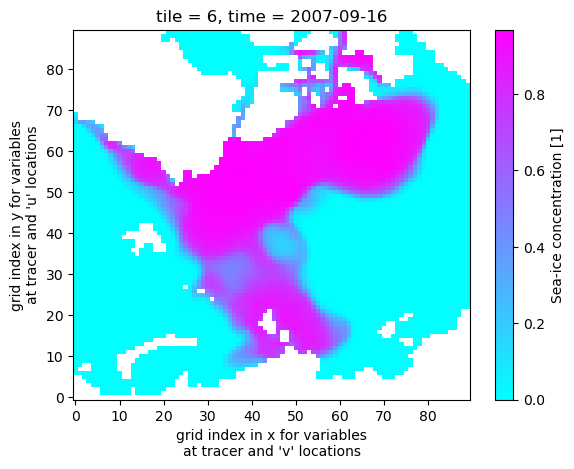
uuid: e6cdf192-400d-11eb-93b5-0cc47a3f49c3Now plot the sea ice concentration/fraction in tile 6 (which approximately covers the Arctic Ocean), during Sep 2007 which at the time was a record minimum for Arctic sea ice.
[3]:
ds_seaice_conc.SIarea.isel(time=8,tile=6).plot(cmap='cool')
[3]:
<matplotlib.collections.QuadMesh at 0x7f141c2bd940>